Laden...

Laden...
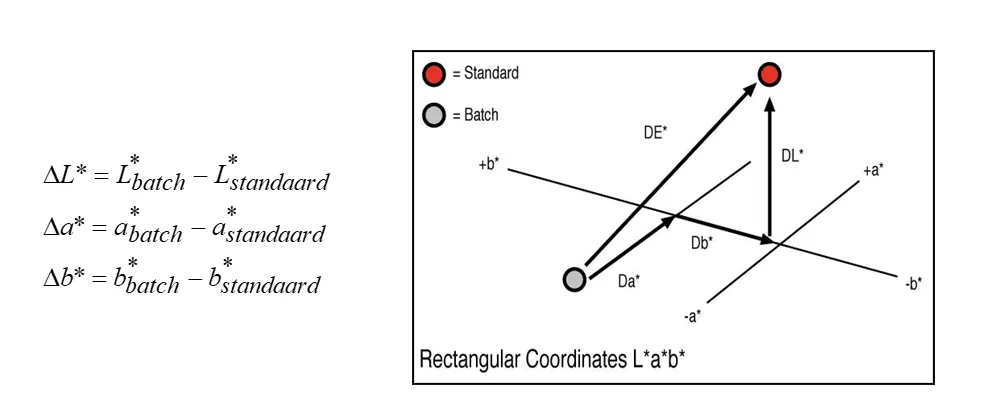
In CIELAB, the difference between two colors can be described as the distance between their coordinates in three-dimensional space. This makes it possible to quantify and objectively assess color differences. In this article, it is explained how color differences are calculated and interpreted in the context of quality control.
A color difference is always determined between a standard and a batch. The differences are expressed as Delta values (Δ):
Conventions:
The total distance between both colors — the total color difference — is given by:
ΔEab = √(ΔL² + Δa² + Δb²)
In addition to Δa* and Δb*, the difference can also be expressed in terms of chroma and hue:
This can help in control processes to diagnose errors faster.
The table below gives the meaning of the delta values. The differences are always defined as: batch minus standard.
| Difference | Interpretation | | ---------- | ----------------------- | | ΔL* > 0 | batch is lighter | | ΔL* < 0 | batch is darker | | Δa* > 0 | batch is redder | | Δa* < 0 | batch is greener | | Δb* > 0 | batch is more yellow | | Δb* < 0 | batch is bluer | | ΔC* > 0 | batch is more saturated | | ΔC* < 0 | batch is less saturated |
These values are used to define acceptance and rejection limits, based on historical performance and visual assessments.
Although ΔE is a useful single number, it has limitations:
Therefore, in modern quality control, more advanced color difference formulas such as ΔE94 or ΔE00 are often used, which better match human perception.
ΔE values are used to:
By systematically working with CIELAB, organizations can objectively assure color quality and support discussions about color differences with measurable data.
👉 Want to learn more about ΔE calculations and tolerance management? View the courses at kleurenschool.nl
Questions about color differences or quality control? Contact us at info@kleurinstituut.nl or call +31 (0)70 364 98 02.
Color deviations arise from variation in material, process, measurement, or specification. 42% is directly linked to process variation. Discover the technical framework for systematic diagnosis with five core steps and RCA methods.
Each material has unique light interactions that require specific measurement methods. Plastics, metals, and textiles each introduce their own challenges for color assessment. Discover material-specific solutions and protocols.
LRV, lightness L*, and spectral values each describe in a different way how a color reflects light. Learn the technical differences between energy reflection, perceptual brightness, and spectral curves using RAL 3000 as an example.