Laden...

Laden...
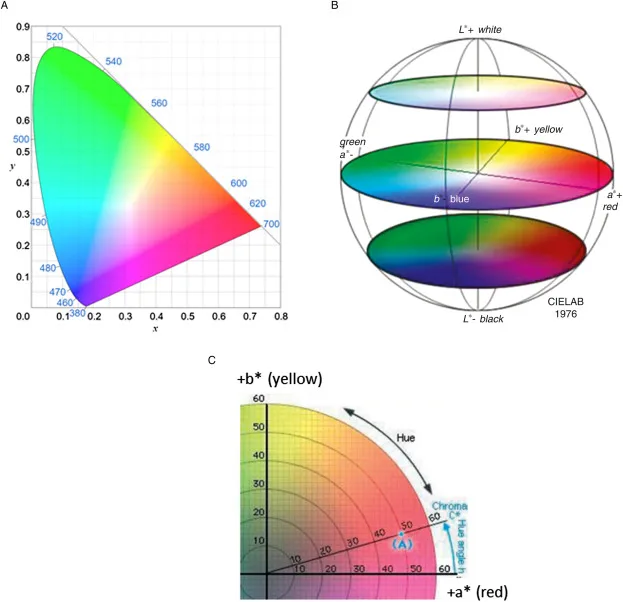
Every color can be described with three tristimulus values X, Y, and Z. These values are always ≥ 0 and form the basis of colorimetry. Instead of these three absolute values, practice often uses the normalized color coordinates x, y, and additionally the luminance component Y. This forms the notation x,y,Y.
The color coordinates are calculated as follows:
The sum x + y + z = 1, whereby the third coordinate can always be derived (e.g., z = 1 – x – y).
In the x,y-chromaticity diagram:
Therefore, when interpreting, it should be considered that all colors in the diagram assume equal brightness (equal Y) — something that is often incorrectly ignored in many visual diagrams.
Important structures within the diagram:
This diagram is widely used to visualize color relationships, but should be interpreted with caution.
In 1942, David MacAdam investigated how large a variation in color could be before a human perceives a difference (JND – just noticeable difference). For various points in the x,y diagram, he determined:
The resulting areas — MacAdam ellipses — are often shown 10× enlarged on maps.
This lack of perceptual uniformity was an important motivation for the development of CIELAB, which specifically attempts to make color differences perceptually consistent.
👉 Want to learn more about color measurement and colorimetry? View the courses at kleurenschool.nl
Questions about chromaticity or CIE standards? Contact us via info@kleurinstituut.nl or call +31 (0)70 364 98 02.
A color measurement rarely goes wrong because of the instrument, but because of the conditions around it. The ten most common mistakes in measuring and assessing color — and how to avoid them.
You agree on color with a supplier not with words but with L*a*b* and ΔE. This is how you record color, tolerance and measurement conditions unambiguously — and avoid surprises at delivery.
Eye and meter both assess color, but not in the same way. When to deploy a color meter, when the trained eye leads, and how to calibrate them against each other.