Laden...

Laden...
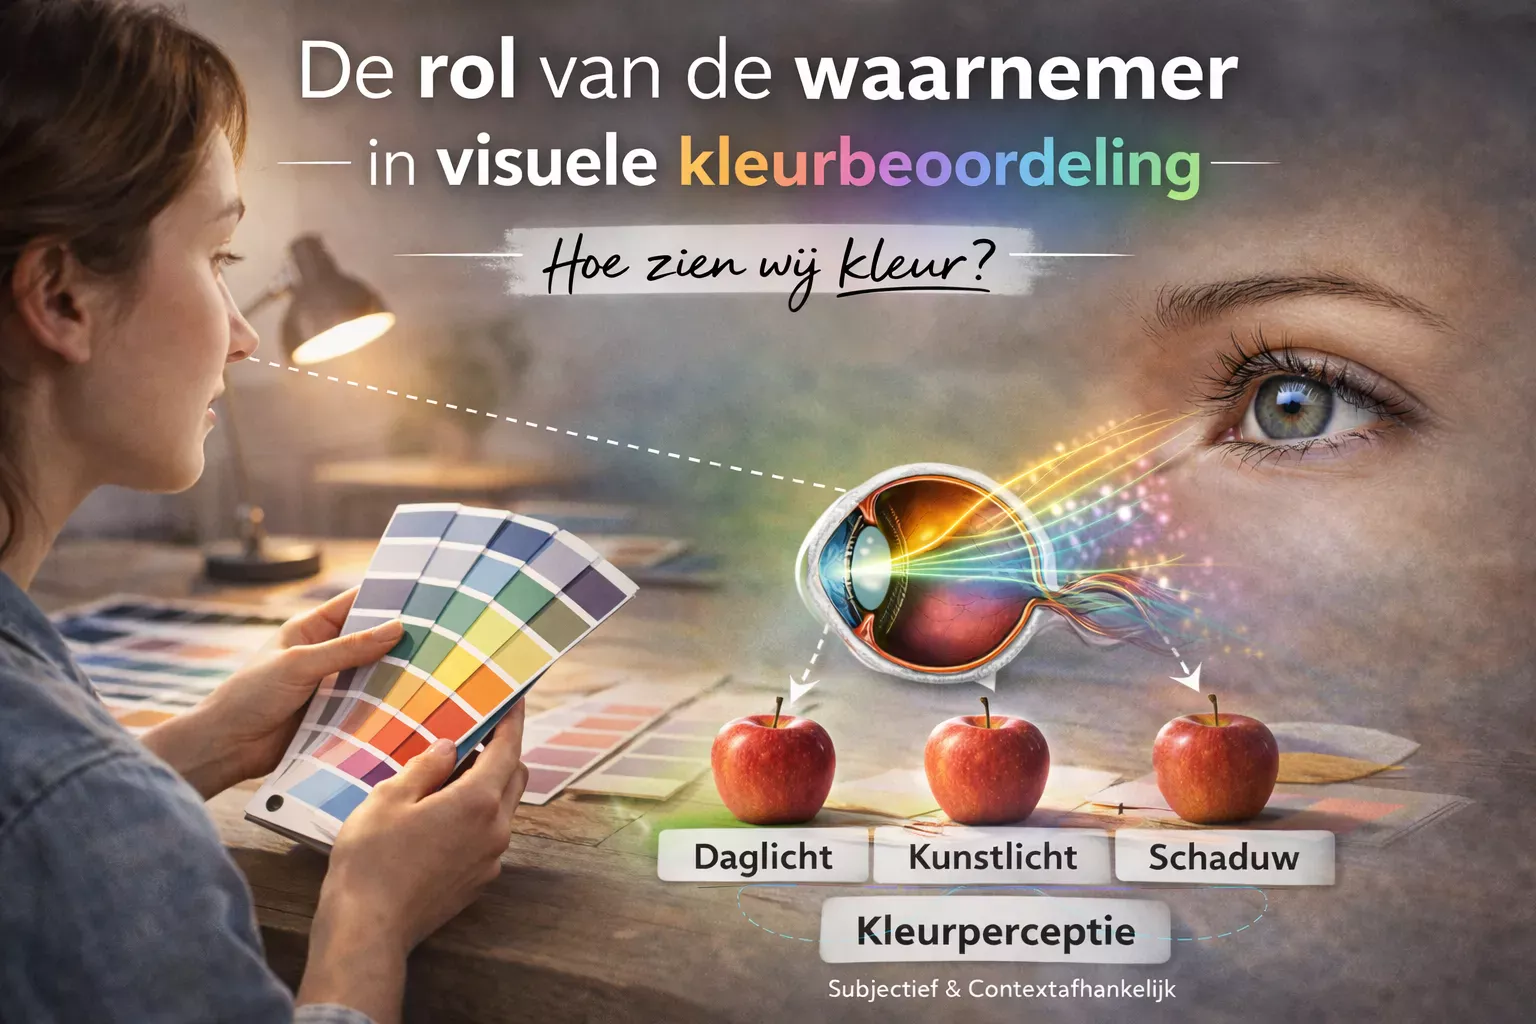
Two experienced color assessors examine the same textile sample under identical lighting. One approves, the other hesitates. No difference in training, no difference in procedure — but a difference in perception. How is that possible?
The answer lies in the instrument with which we perceive color: the human visual system. Unlike a spectrophotometer, that instrument is not standardized. It differs from person to person, changes with age and has built-in limitations that few professionals fully grasp.
This article explains how the visual system processes color, where the variations lie and what that means for everyone who assesses color professionally.
All color perception begins on the retina, in cells we call cones. The human eye contains three types, each sensitive to a different part of the light spectrum:
| Type | Peak sensitivity | Range |
|---|---|---|
| S-cones | ~420 nm | Blue |
| M-cones | ~535 nm | Green |
| L-cones | ~565 nm | Red-orange |
Note: the peaks of M and L lie close together — only 30 nm apart. That is biologically logical: it enables us to perceive subtle color differences in the yellow-green-orange region, exactly the range that was essential for our ancestors to distinguish ripe fruit from unripe.
The cones are concentrated in the fovea, an area of only 1.5 mm in diameter in the center of the retina. The fovea contains exclusively cones — no rods — and is responsible for the sharpest color perception. Everything you "look at directly" is processed here.
Outside it, cone density drops quickly and rods take over. Rods are extremely light-sensitive but color-blind. That is why in your peripheral field of vision you do see movement and brightness, but hardly any color.
The path from a ray of light to a conscious color experience is shorter than you think — but more complex than it seems. It proceeds in five steps.
Step 1 — Phototransduction. Light reaches the retina and is absorbed by the photopigments in the cones. This triggers a biochemical cascade that converts the light signal into an electrical signal. Each type of cone responds to its own wavelength range.
Step 2 — Neural processing in the retina. The electrical signals are processed directly in the retina by bipolar cells and ganglion cells. Already at this level, color coding begins according to the opponent-process theory: signals are converted into red-green, blue-yellow and light-dark channels. The retina is therefore not a passive sensor — it is an active pre-processor.
Step 3 — Transmission to the brain. The ganglion cells together form the optic nerve, which transports the pre-processed information to the brain.
Step 4 — Brain processing. The signals are first processed in the lateral geniculate nucleus (LGN) and then forwarded to the visual cortex. Further analysis takes place here: edge detection, shape recognition, depth perception and color interpretation.
Step 5 — Color perception. The conscious experience of color arises. This is not a direct reflection of the light signal, but a construction by the brain — influenced by physiology, experience, expectations and context.
That last point is crucial. Color is not an objective measurement by the eye. It is an interpretation by the brain. And interpretations vary.
About 8% of all men and 0.5% of all women have a form of color vision deficiency. In a team of ten male assessors, chances are that at least one of them perceives color differently from the rest.
The most common forms:
Protanomaly and protanopia — reduced sensitivity or complete absence of L-cones. Red-green discrimination is impaired. Red shades are perceived as duller and darker.
Deuteranomaly and deuteranopia — reduced sensitivity or absence of M-cones. Here too the red-green range is affected, but the pattern differs subtly from protanomaly. Deuteranomaly is the most common color vision deficiency.
Tritanomaly and tritanopia — reduced sensitivity or absence of S-cones. Blue-yellow discrimination is impaired. This form is rare but occurs in both sexes.
The implication for practice is clear. An assessor with an undetected color vision deficiency simply cannot perceive certain color differences. Not through inattention, not through lack of training — but through biology. Screening is therefore not a formality. It is a requirement.
The minimal test is the Ishihara test: a series of dotted plates that detects red-green deficiencies. For professional environments, a more extensive test — such as the Farnsworth-Munsell 100 Hue Test — is recommended, because it also maps subtler deficiencies and individual strength-weakness profiles.
Color vision deficiencies are congenital. But the "normal" visual system also changes — inevitably, in everyone.
Lens yellowing. From the fortieth year of life, the eye lens gradually becomes yellower. Yellow absorbs blue light. The consequence: older assessors perceive blue shades more weakly than younger colleagues. A subtle blue-yellow difference that a 25-year-old sees effortlessly can be invisible to a 55-year-old.
Pupil constriction. The pupil becomes smaller with age, so less light reaches the retina. At lower light levels, color discrimination decreases. Sufficient illuminance thus becomes not less, but more important over the years.
Cone loss. The total number of cones gradually decreases, as does their individual sensitivity. The effect is subtle but cumulative.
None of these changes means that older assessors are unsuitable. Experience compensates for a lot. But it does mean that regular re-evaluation of color vision is essential — and that the age composition of assessment teams should be a deliberate consideration.
Even within the group of people with "normal" color vision, surprisingly large differences exist. Three sources play a role.
Genetic variation in cone pigments. The exact peak sensitivity of cones is not identical in everyone. Small shifts — a few nanometers — lead to measurable differences in color perception. Two people with "normal" color vision can demonstrably experience the same color differently.
Density and distribution of cones. The ratio between L- and M-cones varies strongly — from 1:1 to 16:1 — without this being classified as a deficiency. This means that the sensitivity balance between red and green differs from person to person.
Neural processing. The way the brain interprets color information also differs. Two people with an identical cone configuration can still report different color experiences due to differences in neural processing and cognitive factors.
The human visual system is an astonishing instrument — but it is not a calibrated measuring device. The variation is real, measurable and relevant.
For organizations that depend on visual color assessment, this yields three concrete recommendations:
Screen all assessors. Not once at hiring, but periodically. Color vision deficiencies are congenital, but age-related changes are progressive.
Train and calibrate. Training does not standardize the visual system, but it does standardize the assessment process and the terminology. Regular calibration sessions — in which the team assesses the same references — make individual deviations visible and manageable.
Combine visual with instrumental. Visual assessment remains indispensable for aspects that instruments do not capture: texture, gloss, overall impression. But for objective color difference measurements, a spectrophotometer is the more reliable instrument. The combination delivers the most robust quality assurance.
The visual system is the instrument with which the industry assesses color daily. Anyone who knows the capabilities and limitations of that instrument makes better decisions — and prevents discussions that are not about the product, but about the observer.
This article is based on insights from "Kleurbeoordelen in de Praktijk" by Mark Kotterink. The full technical elaboration is available at ColorExpertsHub.
Color is not a property of the object but a perception. Discover the three ingredients — light source, object, observer — and the three knobs hue, lightness and saturation.
Color is not a property of an object, but a perception. Four factors — light source, object, observer and context — together determine what we see. Understand these components and take control of your color assessments.
A fundamental insight that forms the basis for every professional color assessment. Color is not a property of the product, but a perceptual phenomenon that arises from the interplay of four elements.